
Infographics define how a picture is worth a thousand words.
I am positive that a very useful, well written, long blog article will sure be appreciated by most readers.
It is great for SEO rankings as well. No Doubt.
But you can also empower their mind with digestible information through fun colors and images representing your explanation!
This is where infographics plays a big role.
Visual Appeal: It transforms complex information into graphics that are easy to grasp and is visually appealing.
The only problem is….
If you look at infographics, they look complicated and not all people can do it.
But thanks for these amazing infographic makers listed below, best infographic design is now possible for a normal folks.
These DIY infographic design tools will help you create one. And they have stunning infographics templates as well to get started quick.
Are you ready to create your own Infographics? Here are some popular tools to create your own Infographics.
Venngage
How do you know if your infographics work?
Venngage is the answer. Venngage is an online infographic design tool to help you create and publish custom infographics and at the same time engage viewers and track results.

Venngage lets you create infographics for your blogs or website and at the same time see how many readers are viewing it.
More things you can do with:
- Graph maker
- Data Visualization Infographics
- TimeLine Infographics
- Mind Maps
- Comparison Infographics
- Process Infographics
and more.
It has a free plan as well so that you can get started quick.
Recommended Links/Reading:
Create Amazing Infographics: 10 Tips For Customizing Your Infographic Templates
Canva – Free infographic maker
Canva is a free editing tool where you can create infographics and other beautiful designs and document.
This tool can conveniently help you convert just about any sort of information into an attention-grabbing visual format, thanks to Canva’s wide array of templates, pre-made design elements, stock photographs, fonts, and layouts.
Canva’s drag-and-drop editor makes it very easy for anyone to design stunning infographics, and on top of this, Canva has everything that you will possibly need to create amazing and professional infographic designs.

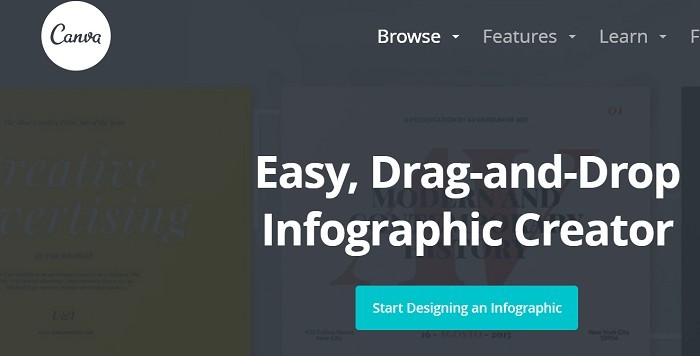
If Canva’s presets don’t suit your taste, though, you always have the option to upload your own design elements and start from scratch.
Visualize.Me
Visualize.Me is a new LinkedIn app that turns your data into an attractive-looking resume using infographic. With just one click, Visualize.me imports all your data from LinkedIn then formats it in an easily digestible content – through a visual resume.

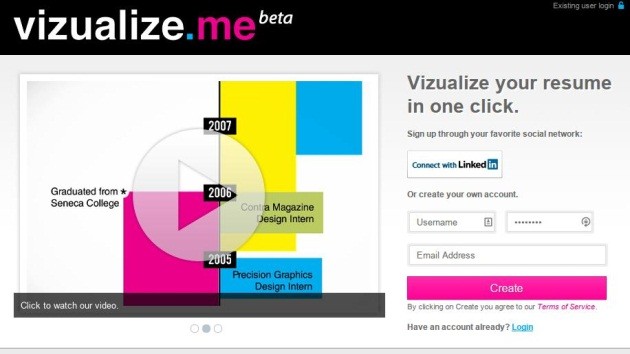
What is great about it is that you don’t need to download anything. To get started, just log in to the site using your LinkedIn account and wait as the magic happens.
The good thing about Visualize.Me is all your details are enclosed in an easily-digestible format. Browsing through a resume is boring, this enlivens it up. The process is easy yet the results are awesome.
Visual.Ly
Don’t have the time to create an infographic? Visual.ly helps you customize your infographic in seconds.Visual.ly has introduced a suite of applications for you to use like the Life of a Hashtag, this application charts the history of a Twitter hashtag; Twitter Showdown lets you compare 2 twitter accounts and show who is the winner.

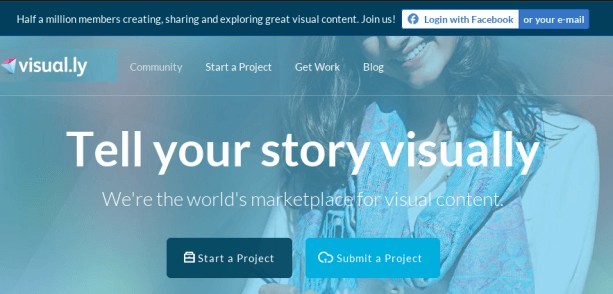
Facebook Insider, Facebook Monsterizer, and a handful of different graphic styles that are immediately available to share or embed.
Many Eyes
Many Eyes is an experiment created by IBM Cognos Software Group.
Their goal with this app is to find the right way to view your data as much art as a science.
Many Eyes were one of the pioneers of social, web-based visualization.

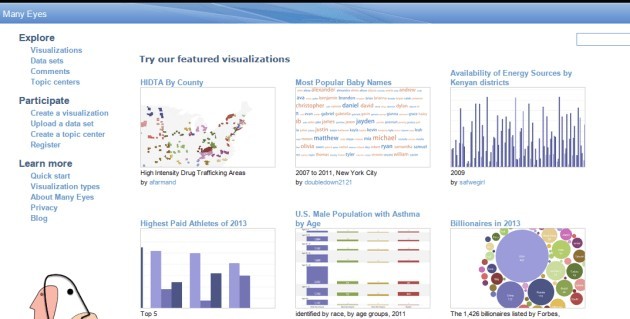
They provide a wide range of visualizations from the ordinary to the experimental where everything can be put together with just a single click.
Piktochart
Picktochart lets you create an innovative infographic by providing you with different kinds of themes, vector images, icons, chart exporter, etc.
They even have ready-made templates so you can get started quickly.

The templates can also be edited like change the fonts, icons, or add more fields in the template.
Infogr.Am

Infogr.am is a simple yet fun way to create static and interactive infographics.
You can import raw data to infogr.am and the site’s online tool will help you turn these data into a creative and visually appealing infographics.
iCharts

If charts are boring, then splurge it up with iCharts. iCharts lets you create great looking charts in minutes with its interactive, and easy to share data.
iCharts make it easy to visualize, and distribute big or small data.
PhotoStats
PhotoStats analyzes the photos you take on your iPhone.
This app generates a cool and stylish infographics that display when and where you take your photos.
If you have a habit of tracking down your photos and reviewing it, or just show off where your photos came from, then PhotoStats will satisfy your cravings.
InFoto Free

InFoto Free is an Android app to help you create an infographic about your photo-taking habits.
The program uses a photo stats analyzer then creates an awesome high resolution infographic taken from your photos.
It tells you what time of the day you prefer to take photos and whether you prefer portrait over landscape photos, and it also tells your favorite city to shoot in.
Easel.ly

Easel.ly is an easy-to-use infographic creator.
It lets you create visual charts and infogaraphics by dragging and dropping elements using a simple interface.
With this, you can create visual ideas online, or develop visual themes that help you get started from the preset infographic style.
Dipity

If you are looking for an infographic with a mix of digital timeline, then Dipity is for you.
Dipity is a free digital timeline website that organizes the web’s content by date and time.
Timeline JS
Another beautifully crafted digital timeline is Timeline JS.
Timeline JS lets you pull media from different sources like Twitter, Facebook, DailyMotion, Google Maps, YouTube, SoundCloud, WikiPedia, etc. then publishes it into a digital timeline.
What is great about it is that you can do all these in your browser.
StatSilk

StatSilk is a web-based and desktop software to make data analysis easy, and enjoyable.
It has all the tools you need to cater to your mapping and visualization needs.
You can visualize nearly every indicator of economic, social, and human development on StatSilk.
It’s really worth a look, but be warned because you are very likely to get yourself absorbed in it.